Biology IA topic ideas: compare eight investigations
Compare eight Biology IA ideas, then use an annotated example with simulated seed data to check measurements, independent samples and cautious conclusions.
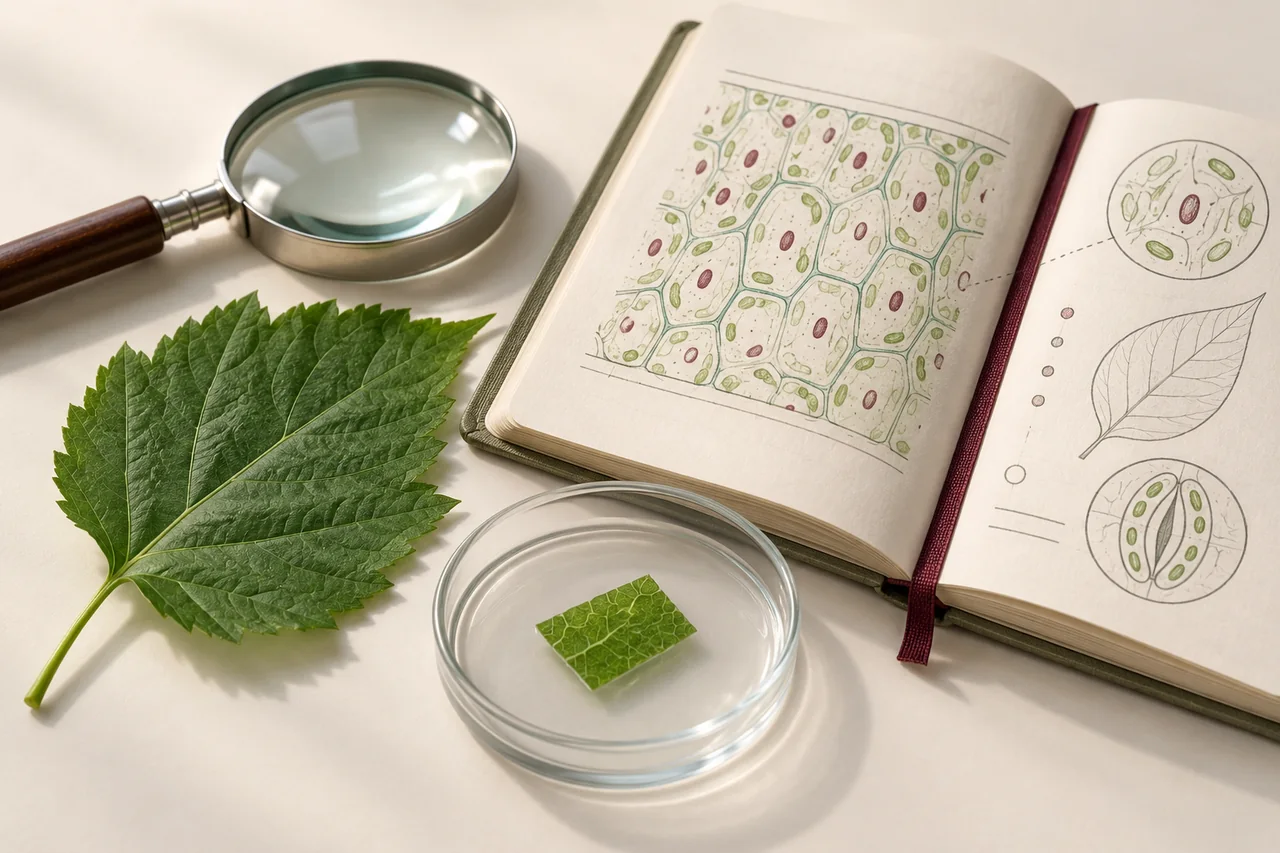
Choose the biological relationship first
Start with a biological process and an outcome you can measure reliably. These original question seeds need adaptation and teacher approval. Check equipment, time, ethical requirements and safe handling before collecting data. A simple organism or public dataset can support useful analysis when the method and limitations are clear.
The seeds are intentionally bounded. Choose one relationship and refine its species, material, conditions and measurement period. Avoid changing several conditions at once and then attributing the result to only one of them.
Plant and tissue investigations
- Seed germination: How does a teacher-approved range of salt concentrations relate to the germination percentage of one seed species over a fixed period? Define germination and keep seed source and conditions consistent.
- Leaf stomata: How does stomatal density vary between leaves of one species collected from two permitted microhabitats? Standardize leaf position and counting area, and consider plant-to-plant variation.
- Plant tissue and osmosis: How does solution concentration relate to percentage mass change in standardized pieces of one plant tissue? Record initial mass and surface preparation consistently.
- Aquatic plant growth: How does a controlled light condition relate to growth of an approved classroom plant culture? Define growth, monitor other conditions and agree disposal with the teacher.
Enzyme and microorganism investigations
- An enzyme measurement: How does one teacher-approved condition affect a measurable reaction involving a suitable classroom enzyme source? Pilot whether the measurement reflects rate and whether source variation is manageable.
- Yeast activity: How does a defined sugar concentration relate to a measured indicator of activity in an approved classroom method? Keep yeast preparation consistent and use the school's safe gas-measurement arrangements where relevant.
Field and database investigations
- Lichen cover: How does cover of a clearly identified lichen group vary across accessible, permitted sites with different measured exposure? Standardize area and identification, and avoid causal claims unsupported by the design.
- Bird observations: How does recorded species richness vary with survey effort in a public database for one region? Inspect effort definitions, repeated locations and observer coverage before analysing the relationship.
Compare variables, measurements and confounders
A topic name is only the start. Read across a row: can you explain the biology, obtain the outcome and address the competing explanation? The checks are prompts to discuss with your teacher, not a complete design.
On a small screen, swipe inside the table to compare all four columns.
| Idea | Variable or comparison | Possible outcome | Confounder or design check |
|---|---|---|---|
| Seed germination | A school-approved solution concentration | Proportion meeting a stated germination rule by a fixed time | Seed batch and conditions shared within each container. Count treatment units separately from seeds. |
| Leaf stomata | A clearly defined microhabitat comparison | Stomata per measured leaf area | Leaf age, position and plant identity. Many fields of view from one leaf do not represent many plants. |
| Plant tissue and osmosis | Solution concentration | Percentage mass change relative to initial mass | Tissue source, geometry and surface liquid handling. A consistent measurement procedure matters. |
| Aquatic plant growth | A defined light condition | Change in a specified size or biomass measure | Starting biomass, temperature and shared culture conditions. Agree a feasible, approved growth measure. |
| Enzyme activity | One permitted condition in an approved classroom method | A justified indicator of reaction rate | Source variation and instrument limits. Establish why the indicator represents the process. |
| Yeast activity | A defined sugar concentration | A specified rate indicator using the school’s approved method | Preparation differences and temperature. Repeated readings from one vessel are not new treatment units. |
| Lichen cover | Measured exposure across permitted sites | Cover within a consistently defined sampling area | Substrate, shade and identification. An observed association alone cannot establish a causal effect. |
| Bird records | Survey effort or a defined environmental comparison | Recorded species richness under comparable survey definitions | Observer coverage, repeated sites and unequal effort. More records may reflect more searching. |
For an observational or database investigation, use an explanatory variable or comparison when you have not assigned a treatment. Wording the question carefully keeps an association from becoming an unsupported causal claim. If you are considering existing records, first check the dataset’s provenance, definitions and sampling.
Compare feasibility before committing
Shortlist two seeds and write the data you need, how you will obtain them and the main confounding factor. Run a pilot for the practical method or inspect actual database rows. The pilot should establish whether the outcome is measurable with available resources and whether your proposed range is meaningful.
For germination, distinguish the number of seeds from the number of independent growing containers. Conditions shared within a container can affect all seeds together. Discuss with your teacher how the sampling or repeat plan can represent biological variation rather than merely generate many rows.
Count independent units, not just observations
Ask which entity could independently receive a different treatment. In the simplified seed example below, a solution is assigned to a whole container. Seeds in that container share the treatment and local conditions. Counting each seed can describe variation within the container; it does not turn that one treatment application into several independent applications.
One shared container
6 seeds observed · 1 treatment unitAll six seeds receive the condition together. An unusual result could reflect something specific to this container.
Separately assigned containers
6 seeds observed · 3 treatment units*The containers can receive conditions independently. Their results can reveal variation between containers.
More containers do not automatically make a sound design. You still need an appropriate comparison, a defensible allocation and sampling plan, and an analysis that respects shared conditions. Repeatedly measuring the same unit improves your description of that unit; it does not create new independent units. Discuss the needed replication with your teacher before collecting data.
The general distinction follows the NC3Rs explanation of experimental units. The seed-container diagram is an original plant-based teaching illustration.
Develop a question and analysis plan
Specify the independent or explanatory variable, response, organism and conditions. Decide how raw observations become the quantity you will compare. State the biological rationale using appropriate sources, then select analysis that fits the data and your understanding. Keep the original records, units and any unusual observations.
Topic: bird diversity in a public dataset.
First question: “Does a longer survey find more species?”
More bounded direction: “How is survey duration associated with recorded bird species richness in complete checklists from one region during one month?”
Before committing: check that duration, completeness, location and date are actually available. Decide how to handle repeated locations and uneven observer coverage. A narrower sentence cannot repair missing or incompatible data.
This is an original planning example. Choose your own region and period from an accessible dataset and explain why the boundary matters. It is a proposed direction to test, not a claim that a particular database or analysis will be suitable.
Bring the pilot, proposed question and main limitation to your teacher. Choose the seed with a defensible route to an answer and a collection plan that fits the school timeline. A popular topic still needs your own method choices, evidence and reasoning.
Biology IA example: from counts to a cautious comparison
What should a Biology IA analysis example help you notice? Follow the path from a defined measurement to a calculation, then ask what the sample can support. This short example continues the seed-container illustration above.
Original teaching example with simulated data. Every number below is invented for learning. Conditions A and B are placeholders, not specified treatments. The table is an analysis exercise, not a complete IA, an assessed exemplar or an experimental protocol. Its numbers are not a recommended sample size.
Start with the observations and their units
For this calculation, assume that each container could be assigned to a condition independently. The same germination rule and observation endpoint apply throughout. A real investigation would need to define the organism, actual conditions, endpoint, allocation and controls before collecting data.
On a small screen, swipe inside the table. Each row represents one container; counts are numbers of seeds.
| Condition | Container | Germinated (seeds) | Observed (seeds) | Germination (%) |
|---|---|---|---|---|
| A | A1 | 6 | 10 | 60% |
| A | A2 | 8 | 10 | 80% |
| A | A3 | 7 | 10 | 70% |
| B | B1 | 5 | 10 | 50% |
| B | B2 | 7 | 10 | 70% |
| B | B3 | 6 | 10 | 60% |
Read the result with four annotations
1. Name the measured quantity
Container A1: 6 out of 10 seeds meet the rule, so its germination percentage is (6 ÷ 10) × 100 = 60%.
Why it matters: a percentage at one endpoint is not a germination rate. Calling it a rate would imply information about change over time that this table does not contain. Keep counts as counts, percentages as percentages, and state the observation endpoint in your own study.
2. Compare the same summary
The mean container percentage is 70% for A and 60% for B. In this simulated sample, A is higher by 10 percentage points.
Check the calculation: A = (60 + 80 + 70) ÷ 3; B = (50 + 70 + 60) ÷ 3. Subtracting two percentages gives a difference in percentage points. It does not mean “10% higher.” Each container has the same denominator here; unequal denominators would require a justified choice of summary.
3. Count independent treatment units
Under the stated assumption, there are three independently assigned containers per condition, with ten seeds observed inside each.
What changes the analysis: thirty seeds in a condition do not automatically mean thirty independent treatment units. Shared container conditions can make their outcomes related. Use the unit diagram above to distinguish the treatment unit from observations within it. A shared chamber-level treatment would require a different count.
4. Limit the claim to the evidence
The container percentages vary from 60% to 80% in A and 50% to 70% in B. The descriptive difference alone does not establish a dependable treatment effect.
What is still missing: the ranges overlap, but overlap alone is not a significance test. No inferential test or uncertainty estimate is supplied here. An appropriate analysis would need to respect the design, the response type and its assumptions; a mechanism would also need biological evidence.
Make the limitation change the next decision
Suppose A and B also came from different seed batches. Batch quality could then explain some or all of the apparent condition difference. That is more useful than writing only “there may have been human error”: it identifies a competing explanation and shows why the treatment claim is weaker. In your own approved design, discuss how allocation, replication and control of relevant batch differences could address it.
Before using any Biology IA example, ask: what does one row represent, how was the response calculated, which units are independent, and how far can the conclusion travel? If your evidence comes from existing records instead, use the Biology database-quality guide to check definitions and sampling before applying the same questions.
Your next-step checklist
Checklist choices stay in this browser.
References and course guidance
This is an original practical guide from IBvia. The examples are illustrative; your subject guide, assessment year and school instructions determine the requirements.
Keep working on your next step
Design a science IA you can actually carry out
Move from a research question to a safe pilot, usable data and a specific evaluation of your method.
Read the guide ↗
Check database quality before starting a Biology IA
Audit provenance, sampling effort and definitions so your database analysis supports a defensible biological question.
Read the guide ↗